
For companies to survive in the market, they must always be under the microscope and observe the growth or decline of their products and make decisions based on them.
There are different strategies for this. One such marketing strategy is to use the Boston Consulting Group matrix, or BCG for short.
What is BCG? ( What is the Boston Matrix?)
How can a company help manage its products?
How does a company avoid losing money?
Many other questions. Stay with us to find answers to these questions and many more.
What is the Boston Matrix? or BCG
The BCG matrix or Boston group matrix was presented and developed in the 1970s by Bruce D. Henderson for the Boston Consulting Group.
Henderson presented a matrix to analyze, evaluate and compare market growth rate, and market share rate, choose the right strategy to make decisions about products, and develop or stop businesses. This matrix is known as BCG. This term is usually applied to businesses that offer a basket of products. Like the Samsung company, which works both in the field of smart ears and produces household appliances.
the Boston matrix is a method that indicates which products are beneficial to the company and which are harmful based on market growth indicators and market shares.
For this reason, it can be decided that it is more appropriate to focus on which products should be sold more and which products should be removed from the production line.
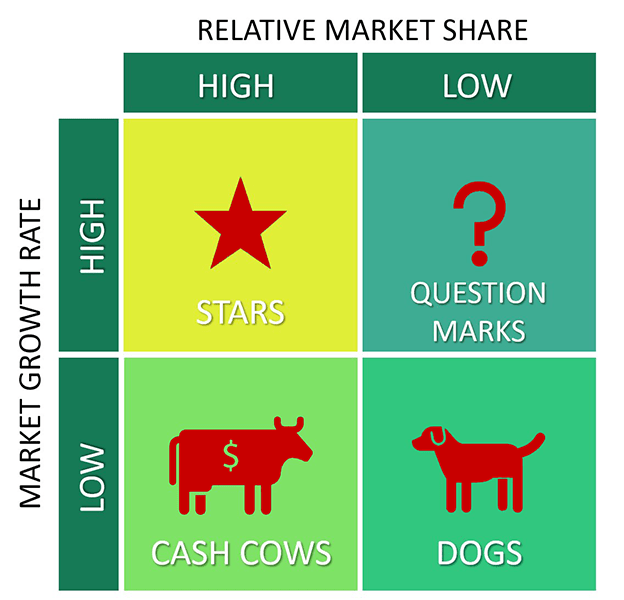
As you can see in the picture above, 4 brands of the company’s products are considered and we will explain each one below.
(Note that this matrix can be used for any problem, not just for evaluating multiple products. For example, different branches of a company can be placed in these categories based on the indicators mentioned. )
- Star
According to the matrix, a glowing product is awarded a star. This means high sales (market share) and growth (market growth).
These are better products to invest in their production.
- question mark
There are products in this category that have a growing market but do not make many sales. The future of products in this category is unpredictable and is marked with a question mark.
Many factors affect whether a question mark becomes a star or a dog, so you need to do more research to decide on these products.
- dairy cow
This category includes products that have a good market share of sales, but the market growth rate is slow. This category is arguably the most profitable product category.
In most cases, the products in this category have a profit that can be used to invest in other products.
- Dog
If you have products in this category, you better continue manufacturing. The market for dog products is showing slow growth and they have gained a small share of the sales market.
Of course, it’s possible that these products could suddenly fall into a different category if other factors outside of this matrix change, but the likelihood of that happening is slim.
Boston matrix based on the product life cycle
Another method that can be used to describe the Boston Matrix is based on two metrics: time and revenue, which results in the same product lifecycle.
In this way, each product is first placed in a section with a question mark. So, it’s time to dump her and move on. Now, based on what is happening in the market for this product, it will enter the star section in the most ideal conditions.
That is, at this point, it is experiencing more and growing sales. Again, unless something unfortunate and unexpected happens, this product will continue to grow and enter the mature or dairy cow stage.
At this stage, we were able to enter a stable market and achieve strong sales. Over time, this product will enter the realm of dogs.
In this area, sales of products decrease over time. Note that this cycle is considered the optimal cycle for each product.
While many products may fail at the beginning of sales and enter the puppy stage directly from the question mark stage.
Benefits of the Boston Consulting Group Matrix
As we mentioned, this matrix is better suited for large companies that either have a large number of products or manage multiple branches of the same product in different locations.
Small companies and startups do not need these matrices anymore, however, they can use these matrices to analyze the sales and investment markets of their products.
However, the advantages of this method of analysis include:
- This matrix is easy to use
- Suitable for short-term investment
- Not all capital is invested in products whose future is uncertain
- It uses only two indicators to determine the status of the product.
- Not suitable for long-term investment.
- Other factors influencing the market are not taken into account.
- It does not specify the amount of revenue generated by the product
. For example, products in the dog category can be profitable if they are in small markets.

How to use the Boston matrix?
As we said, the BCG model is a useful and practical tool for your business. To use the Boston group matrix, you need to go through some steps. In this section, we will explain these steps.
Step 1: Select the desired unit
Choose the desired unit and segment your products according to market share and market growth. You can use the Boston matrix to analyze strategic business units, individual brands, different products, etc. Remember, what unit you choose affects your analysis.
Step 2: Define the market
Defining the market is the most important thing you do at this stage. If you define the market clearly, you can correctly identify the position of the company’s portfolio. While the incorrect and ineffective definition of the market leads to weakness and defects in your classification.
Step 3: Calculate the relative market share
Now we need to calculate the relative market share for the selected unit. We can do this calculation based on revenues or market share.
Relative market share can be calculated in terms of “revenue” or “market share“. For this, the market share (revenue) of the brand is calculated relative to the market share or revenue of the biggest competitor in that industry.
Step 4: Calculate the growth rate of the industry
Industry growth rates can be found in reports available online. Also, you can calculate this rate by looking at the average revenue growth of leading companies. The industry growth rate is measured by percentage. The obtained number is the percentage placed on the y-axis.
Step 5: Draw circles on the matrix
After calculating all the figures, you need to put them in the matrix. You can do this by drawing a circle for each brand in each unit or for all brands in a business. Note that the size of each circle is determined by the revenue generated by that brand.
Conclusion
Remember that the result of the Boston Group matrix analysis only gives you a snapshot of the current market situation. What is going to happen in the future to today’s changing market is not known at all. But in any case, you should be able to lead your business in the best direction in any situation. In this way, pay attention to the stars, milk cows, dogs, and the question mark of your business.
It¦s really a great and useful piece of information. I am happy that you simply shared this helpful information with us. Please keep us informed like this. Thanks for sharing.
It is a pleasure and an honor that you like the articles on the website. Please share your comments on other articles with us